


Opcenter™ Reporting
Opcenter Reporting from Siemens offers a unique, scalable and cost-effective solution for your operational reporting.
The focus is on the simplest possible handling so that you can operate and expand the solution without specially trained IT staff. There is access to runtime and historical data, with which you can compare day-to-day activities.
As a rule, tabular reports with integrated diagrams are used. These can be created easily and graphically, can be scheduled and, of course, can also be printed.
Especially in interaction with other components of the Siemens MOM portfolio, you can leverage the full potential of the solution. You can benefit from the data models that have already been prepared without having to make adjustments.
If these functions are not sufficient, or if you also want to process data from external systems, these can be used by means of a direct database connection, regardless of whether SQL or Oracle.


Functionalities
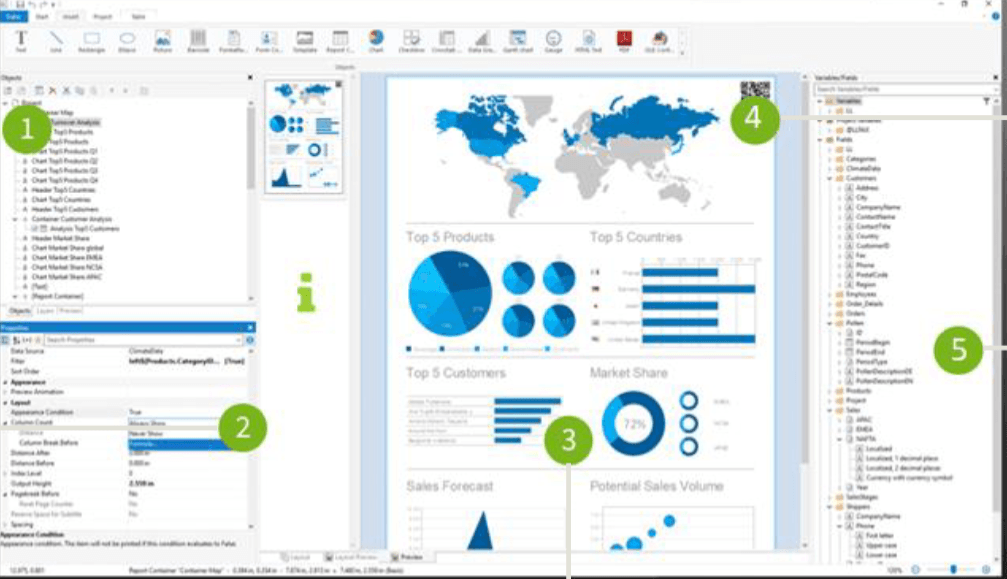
- Report Designer:
- Design surface for the graphical creation of Reports
- Report Viewer (HTML5):
- Surface for displaying generated reports in the common HTML5 format. This ensures that your reports are displayed correctly regardless of specific end devices.
- Data Source Module:
- Administrative interface for implementing or adapting data sources.
- User Management Component (UMC):
- The central UMC of the MOM portfolio is used. If you have already implemented an instance through the operation of other modules, it can be used directly without any further adjustments.

Report Designer
Rich Designer Objects
Add simple tables, comprehensive master-detail reports / sub-reports, cross tabs, charts, RTF text, barcodes, graphs, PDF objects, custom objects and more.
Chart Types
With the Report Designer you can use a variety of diagrams, measured values and shapefiles to enhance your reports with professional graphics.
HTML Report Viewer
With a wide variety of chart types - from bar and pie charts to geo-visualization, gauges, crosstabs, Gantt, etc. You can always find a solution for your specific data visualization needs.
Interactive drill down
You can break down the hierarchy from summary information to more detailed data. The expandable regions offer a drill-down function that provides the user with clearly structured information.
Report parameters
Allow your users to preview specific values. In this way, you can determine what information should be displayed.
Export
Reports can not only be printed and previewed. They can also be exported directly in the format you want.

-
![]()
MOM
Photo By: John DoeButton
Your added value with Opcenter Reporting in the MOM portfolio
- Seamless integration into your UMC, „trusted app“ and single sign-on
- Integration oft he viewer into other applications
- A full set of APIs enables any operation tob e performed programmatically
- Simple installation of your employees based on a uniform look and feel
